The Climate Change Connection (10 minutes - Review)
Start your lesson with a discussion about cars and the basic fuel types they use: gasoline, diesel and other petroleum based liquids. What’s so bad about using and burning gasoline?
We all know that cars contribute to air pollution with byproducts including Nitrogen and Sulfur Oxides (NOx, Sox) and particulate matter (soot). But how does driving a car, taking a bus or riding the subway relate to climate change and greenhouse gas emissions? Every time we use a transportation source, fuel is consumed and greenhouse gases are produced and emitted into the atmosphere. This contributes to a phenomena known as climate change.
What is climate change? Climate Change is the international concern that increasing concentrations of greenhouse gases (GHGs) in the atmosphere are changing the climate in ways detrimental to our social and economic well being. (For more ideas on how to integrate issues regarding climate change into your classroom visit:
https://www.smithsonianconference.org/climate/teachers/teaching-climate-change/)
A greenhouse gas is created when burning a fossil fuel. The process releases a compound called carbon dioxide. These gases accumulate in the atmosphere and trap heat close to the Earth’s surface. With more and more gases released, the amount of heat being trapped also increases. This can begin to raise temperatures around the globe. What’s the big deal with that? One degree of change in world temperature (Celsius or Fahrenheit) influences everything from the number of storms we get each year, to the amount of water in the oceans. The big concern is that coastlines will be reshaped and climate patterns shifted. This could much so that farming practices and even whole cities will change drastically at the cost of environmental and human health.
Cars and other transportation devices use a lot of fossil fuels. Gasoline and diesel are used in vast quantities around the world. Each time we use this resource greenhouse gases are released, contributing to the climate change problem.
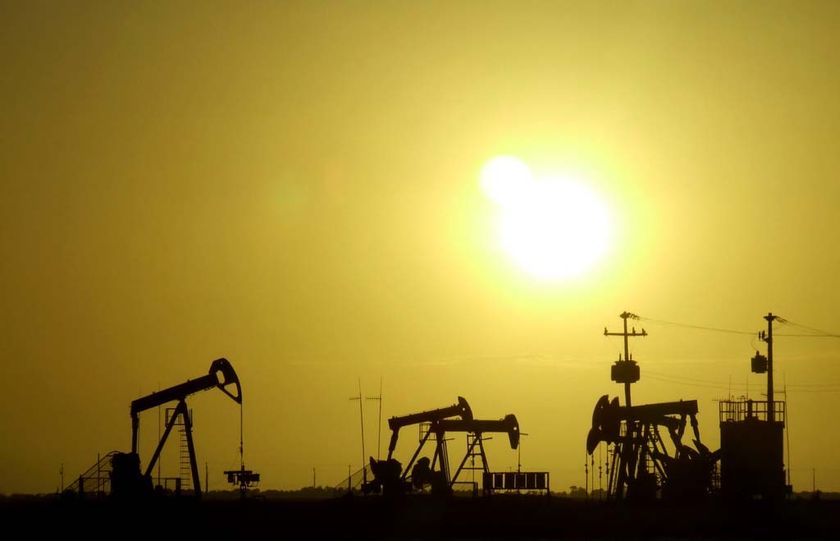
Gasoline and diesel fuels are pumped from the earth with large oil rigs such as the ones depicted above.
Carbon Footprinting (10 minutes - Investigate)
Now focus on how conventional transportation use may impact your local community. Talk to students about their connection to this problem. How many cars does your family own? How often are they used? Have students conduct surveys about car usage, recent plane trips and other traveling that may create a footprint.
Explain to students how we measure the impact of our use of these fuels: an ecological footprint. This creates an inventory of the impacts that a behavior or action may have on the environment. In this case we are focusing on the carbon footprint, a more specific kind of ecological footprint focused on one kind of emission.
From the Livable Streets Project (
https://streetseducation.org/) here are some sample carbon footprints of average transportation options if you lived 5 miles from your school. (A total commute of 10 miles per day)
• Rode in an SUV, your 10-mile commute would create 16 pounds of carbon dioxide.
• Rode in an average car, you would create 12 pounds of carbon dioxide. To offset all that carbon, you’d need to plant 16 trees per year.
• Rode in a hybrid car, your commute would create 4 pounds of carbon dioxide. To offset all that carbon, you’d need to plant 6 trees per year.
• Took the bus, you would put 5 pounds of carbon dioxide into the atmosphere.
• Rode the subway, you would put 2.5 pounds of carbon dioxide into the atmosphere.
• Walked, biked, or skated, your commute would create no carbon dioxide.
Math Connection
There are a number of ways to measure the impact of vehicle use on the environment. One method is to determine the ecological footprint of carbon dioxide emissions released when a car burns its fuel. Below is a common formula used that can give an approximation of the amount of lbs of C02 produced based on the fuel efficiency and number of miles an average American drives in a year. (Source: Sierra Club)
Footprint = (12,000 Miles / Fuel Efficiency) x (19.564 lbs-C02) = ______ lbs-C02/gallon
12, 000 Miles = Average number of miles an American drives in a year
Solutions (5 minutes - Frame/Reframe)
So what can we do about this? We can make informed decisions about which kind of traveling impacts our environment the most and come up with ways to decrease or minimize the amount and kind of travel we choose. Some examples include:
• Car share programs
• Ride bikes
• Commuter lanes
• Public transportation etc
Brainstorm with your class about ways to reduce the climate change impacts of cars and other vehicles on the environment.
To provide examples of how designers are tackling the climate crisis reference some entries from the
2010 National Design Triennial that are helping communities re-think the kinds of fuels, materials and infrastructure we use to get around:
•
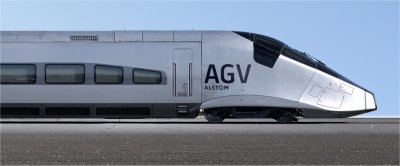
AGV (Automotrice à Grande Vitesse) [High-speed Self-propelled Train]: Trains are among the most sustainable forms of transportation, and currently there is great international interest in replacing air and automobile regional travel with fast trains. The AGV, designed in France by Alstom Transport’s Design and Styling Studio, is at the forefront of high-speed, energy-efficient trains built from nearly ninety-eight percent of recyclable materials, such as aluminum, steel, copper, and glass. Its low weight and efficient traction systems make for a 15% reduction in energy use compared to current trains. It also produces its own electricity from a regenerative braking system: while the train is slowing down, up to eight megawatts of unused electricity is returned to the train’s power network.
•
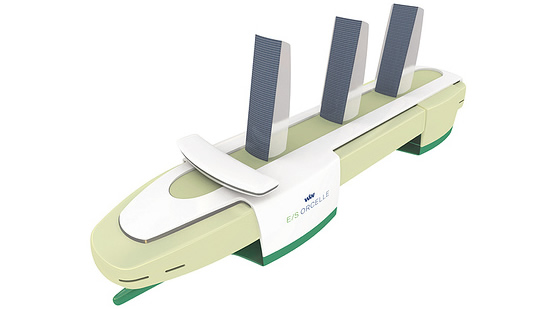
E/S Orcelle Cargo Carrier: Shipping and air travel have been challenging to regulate in terms of new environmental standards. A dramatic step forward is the E/S Orcelle (E/S stands for environmentally sound; orcelle is French for an endangered type of dolphin), a sustainable vessel proposed by the Swedish/Norwegian transportation company Wallenius Wilhelmsen Logistics. The concept is based on zero emissions and the premise that by 2025 ships will be propelled without oil. The E/S Orcelle would have an optimum cargo capacity of up to 50% more space than today’s modern car carriers and could transport ten thousand cars. This increase is achieved by the vessel’s five-hull shape along with its use of lightweight materials and energy from renewable sources.
•
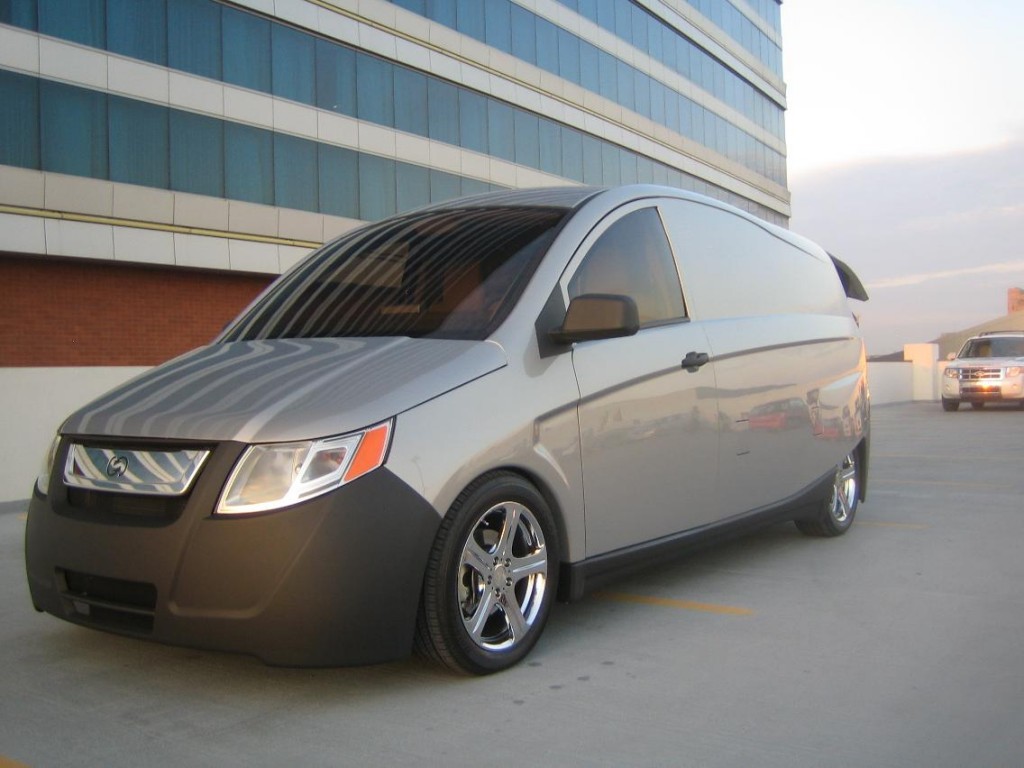
IDEA Plug-in Hybrid Electric Fleet Vehicle: Reducing wind resistance and vehicle weight are the two keys to improving battery performance and reducing costs in electric vehicles. A recent start-up, Bright Automotive, took these objectives to task with the IDEA, a plug-in hybrid electric van designed for light-duty commercial and government fleets. Bright Automotive expects each vehicle to reduce fuel consumption by 1,500 gallons per year and carbon-dioxide emissions by up to sixteen tons per year over competing vehicles.
Carbon Footprint Challenge (15-20 minutes - Generate)
From selected scenarios students calculate some example carbon footprints. Use the table below to plug into the following equation to calculate the carbon footprint for each scenario:
(miles traveled) / (Fuel efficiency mpg) x (carbon footprint constant) = _____ tons of CO2
|
Vehicle Type
|
Constant
|
|
van, 12 mpg
|
ton mile 0.19
|
|
truck 10 mpg
|
ton mile 0.16
|
|
truck 14 mpg
|
ton mile 0.12
|
|
truck 12 mpg
|
ton mile 0.11
|
|
automobile, 20 mpg
|
ton mile 0.24
|
|
automobile, 50 mpg
|
ton mile 0.094
|
|
tram NA
|
mile 0.92
|
|
tanker ship
|
ton mile 0.61
|
|
freighter inland
|
ton mile 0.09
|
|
oceanic freight ship
|
ton mile 0.015
|
|
container ship
|
ton mile 0.17
|
|
train, freight 85 mpg
|
ton mile 0.02
|
|
train, regional 80 mpg
|
person mile 0.024
|
|
train, long-distance 90 mpg
|
person mile 0.013
|
|
helicopter 8 mpg
|
minute 1.6
|
|
air, passenger, regional 6 mpg
|
person mile 0.78
|
|
air, passenger, intercont. 9 mpg
|
person mile 0.41
|
|
air, freight, regional 2 mpg
|
ton mile 2.8
|
|
air, freight, intercont. 2.5 mpg
|
ton mile 1.6
|
Source: CO2 Equivalency values Philip White, May 2007
• Scenario 1: You take a trip to Alaska from Boston. To get there you fly first to Seattle 2100 miles and then take a oceanic freight ship 2300 miles to Alaska’s Southern coast. What’s the carbon footprint?
• Scenario 2: You ride 25 miles each day from school to home in a 20 mpg car. What’s your carbon footprint if you make a roundtrip each day for a week (5 days in your school week)
• Scenario 3: You take a regional train from Portland to Los Angeles, 980 miles. What’s the carbon footprint?
• Scenario 4: You ride a 16 ton truck from New Orleans to Chicago, 1250 miles. What’s the carbon footprint?
As a further design challenge - encourage students to come up with alternative ways of getting from each location that minimizes the carbon footprint for each trip.
Local and Personal Footprints (10 minutes - Edit and Develop)
After completing some sample scenarios, pull out some local maps. Have each student calculate the approximate distance they travel from home to school. Using this information, students should calculate their own carbon footprints of this trip. How much carbon is released each week, each month and each year. What about the carbon footprint of the class altogether?
Create a chart on the board with everyone’s impact and calculate the grand total.
Share responses - who is a carbon hog? (Share and Evaluate) Brainstorm about what can we do to minimize our impacts. (Finalize)